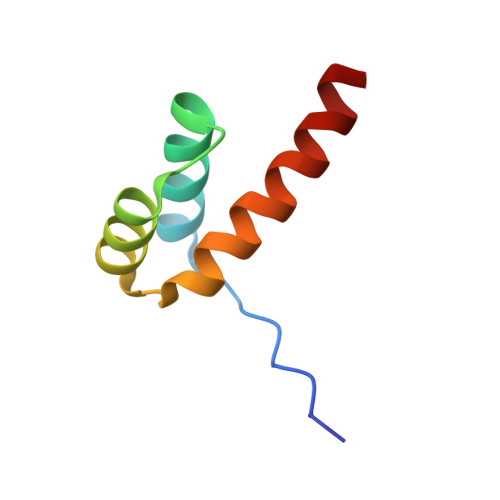
8R7F | pdb_00008r7f

Transcription factor BARHL2 homodimer with spacing two bp


Experimental Data Snapshot

  • Method: X-RAY DIFFRACTION
  • Resolution: 1.98 Å
  • R-Value Free: 
    0.273 (Depositor), 0.277 (DCC) 
  • R-Value Work: 
    0.233 (Depositor), 0.239 (DCC) 
  • R-Value Observed: 
    0.235 (Depositor) 

Starting Model: experimental
View more details

wwPDB Validation   3D Report Full Report


This is version 1.2 of the entry. See complete history


Literature

DNA-guided transcription factor interactions extend human gene regulatory code.

Xie, Z.Sokolov, I.Osmala, M.Yue, X.Bower, G.Pett, J.P.Chen, Y.Wang, K.Cavga, A.D.Popov, A.Teichmann, S.A.Morgunova, E.Kvon, E.Z.Yin, Y.Taipale, J.

(2025) Nature 641: 1329-1338

  • DOI: https://doi.org/10.1038/s41586-025-08844-z
  • Primary Citation of Related Structures:  
    5EG0, 5NO6, 8BYX, 8BZM, 8R7F, 8R7Z

  • PubMed Abstract: 

    In the same way that the mRNA-binding specificities of transfer RNAs define the genetic code, the DNA-binding specificities of transcription factors (TFs) form the molecular basis of the gene regulatory code 1,2 . The human gene regulatory code is much more complex than the genetic code, in particular because there are more than 1,600 TFs that commonly interact with each other. TF-TF interactions are required for specifying cell fate and executing cell-type-specific transcriptional programs. Despite this, the landscape of interactions between DNA-bound TFs is poorly defined. Here we map the biochemical interactions between DNA-bound TFs using CAP-SELEX, a method that can simultaneously identify individual TF binding preferences, TF-TF interactions and the DNA sequences that are bound by the interacting complexes. A screen of more than 58,000 TF-TF pairs identified 2,198 interacting TF pairs, 1,329 of which preferentially bound to their motifs arranged in a distinct spacing and/or orientation. We also discovered 1,131 TF-TF composite motifs that were markedly different from the motifs of the individual TFs. In total, we estimate that the screen identified between 18% and 47% of all human TF-TF motifs. The novel composite motifs we found were enriched in cell-type-specific elements, active in vivo and more likely to be formed between developmentally co-expressed TFs. Furthermore, TFs that define embryonic axes commonly interacted with different TFs and bound to distinct motifs, explaining how TFs with a similar specificity can define distinct cell types along developmental axes.


  • Organizational Affiliation
    • State Key Laboratory of Cardiovascular Diseases and Medical Innovation Center, Shanghai East Hospital, School of Medicine, Tongji University, Shanghai, China.

Macromolecules

Find similar proteins by:  (by identity cutoff)  |  3D Structure
Entity ID: 3
MoleculeChains Sequence LengthOrganismDetailsImage
BarH-like 2 homeobox proteinC [auth A]64Homo sapiensMutation(s): 0 
Gene Names: BARHL2
UniProt & NIH Common Fund Data Resources
Find proteins for Q9NY43 (Homo sapiens)
Explore Q9NY43 
Go to UniProtKB:  Q9NY43
PHAROS:  Q9NY43
GTEx:  ENSG00000143032 
Entity Groups  
Sequence Clusters30% Identity50% Identity70% Identity90% Identity95% Identity100% Identity
UniProt GroupQ9NY43
Sequence Annotations
Expand
  • Reference Sequence
Find similar proteins by:  (by identity cutoff)  |  3D Structure
Entity ID: 4
MoleculeChains Sequence LengthOrganismDetailsImage
BarH-like 2 homeobox proteinD [auth E]63Homo sapiensMutation(s): 0 
Gene Names: BARHL2
UniProt & NIH Common Fund Data Resources
Find proteins for Q9NY43 (Homo sapiens)
Explore Q9NY43 
Go to UniProtKB:  Q9NY43
PHAROS:  Q9NY43
GTEx:  ENSG00000143032 
Entity Groups  
Sequence Clusters30% Identity50% Identity70% Identity90% Identity95% Identity100% Identity
UniProt GroupQ9NY43
Sequence Annotations
Expand
  • Reference Sequence

Find similar nucleic acids by:  Sequence   |   3D Structure  

Entity ID: 1
MoleculeChains LengthOrganismImage
DNA (5'-D(*CP*TP*AP*AP*AP*CP*GP*GP*GP*CP*AP*AP*TP*TP*AP*G)-3')A [auth B]16Homo sapiens
Sequence Annotations
Expand
  • Reference Sequence

Find similar nucleic acids by:  Sequence   |   3D Structure  

Entity ID: 2
MoleculeChains LengthOrganismImage
DNA (5'-D(*CP*TP*AP*AP*TP*TP*GP*CP*CP*CP*GP*TP*TP*TP*AP*G)-3')B [auth D]16Homo sapiens
Sequence Annotations
Expand
  • Reference Sequence
Experimental Data & Validation

Experimental Data

  • Method: X-RAY DIFFRACTION
  • Resolution: 1.98 Å
  • R-Value Free:  0.273 (Depositor), 0.277 (DCC) 
  • R-Value Work:  0.233 (Depositor), 0.239 (DCC) 
  • R-Value Observed: 0.235 (Depositor) 
Space Group: P 1 21 1
Unit Cell:
Length ( Å )Angle ( ˚ )
a = 45.335α = 90
b = 63.169β = 111.72
c = 51.323γ = 90
Software Package:
Software NamePurpose
REFMACrefinement
Aimlessdata scaling
XDSdata reduction
PHASERphasing

Structure Validation

View Full Validation Report


Entry History & Funding Information

Deposition Data


Funding OrganizationLocationGrant Number
Swedish Research CouncilSwedenC24905003

Revision History  (Full details and data files)

  • Version 1.0: 2024-12-04
    Type: Initial release
  • Version 1.1: 2025-04-23
    Changes: Database references
  • Version 1.2: 2025-06-11
    Changes: Database references